Ridgefield, WA 98642 - Condos
This week the median list price for Ridgefield, WA 98642 is $485,000 with the market action index hovering around 54. This is an increase over last month's market action index of 49. Inventory has increased to 7. Click here to stay informed with the Ridgefield market!
This answers “How’s the Market?” by comparing rate of sales versus inventory.
The market has been cooling over time and prices plateaued for a while. Despite the consistent decrease in MAI, we’re in the Seller’s zone. Watch for changes in MAI. If the MAI resumes its climb, prices will likely follow suit. If the MAI drops consistently or falls into the Buyer’s zone, watch for downward pressure on prices.
Never miss important changes in the Camas market.
| Median List Price | $849,000 |
| Median Price of New Listings | $810,068 |
| Per Square Foot | $331 |
| Average Days on Market | 161 |
| Median Days on Market | 70 |
| Price Decreased | 34% |
| Price Increased | 6% |
| Relisted | 6% |
| Inventory | 137 |
| Median Rent | $2,760 |
| Market Action | 35 |
| Slight Seller's Advantage | |
We continue to see prices in this zip code bounce around this plateau. Look for a persistent down-shift in the Market Action Index before we see prices deviate from these levels.
Each segment below represents approximately 25% of the market ordered by price.
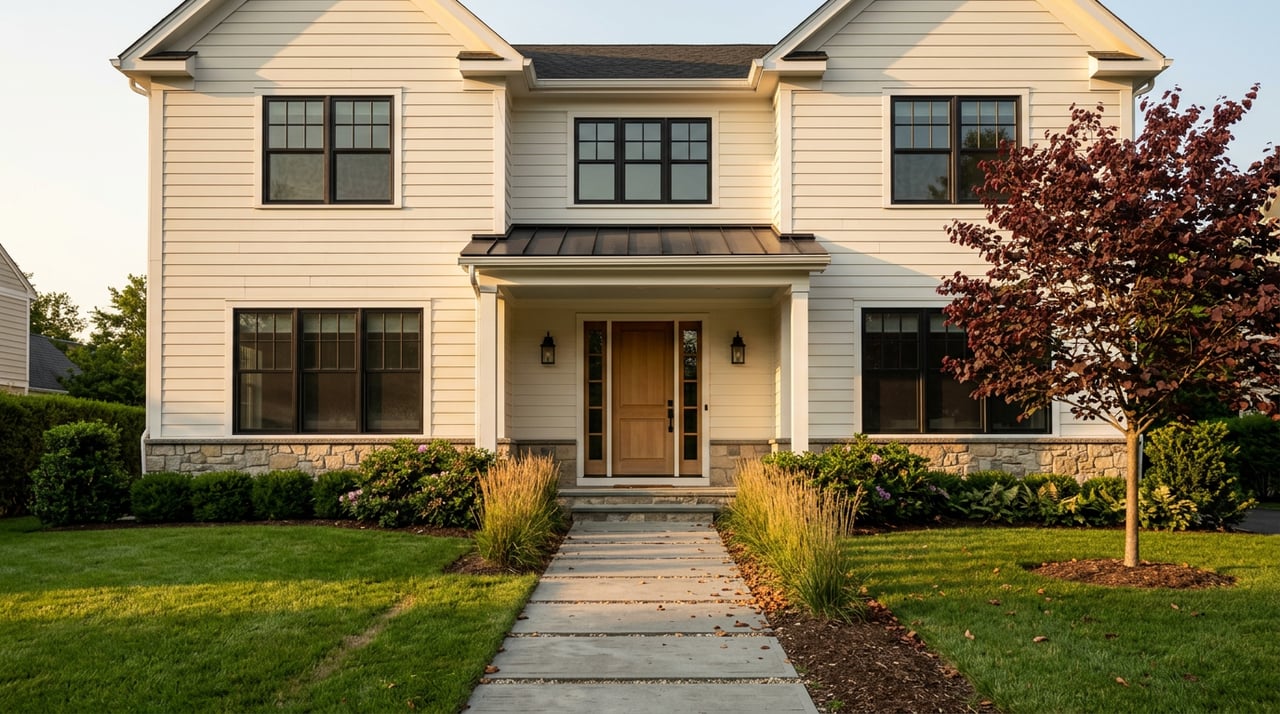

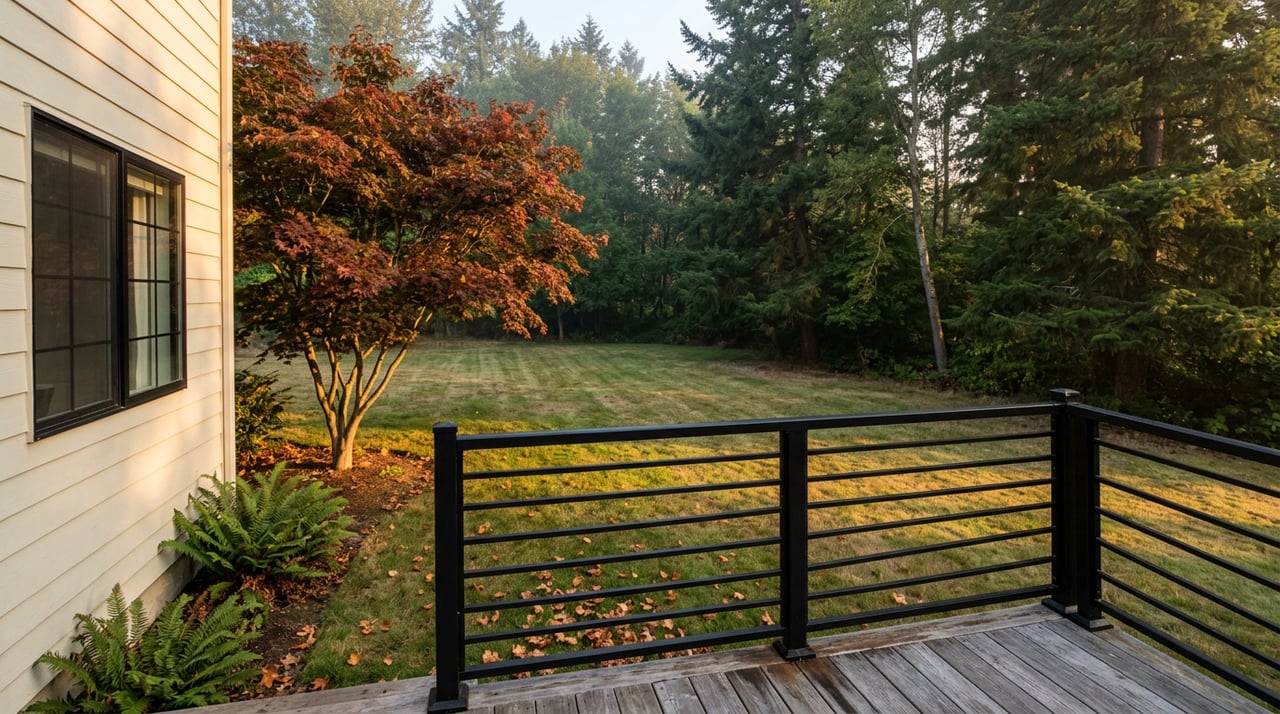
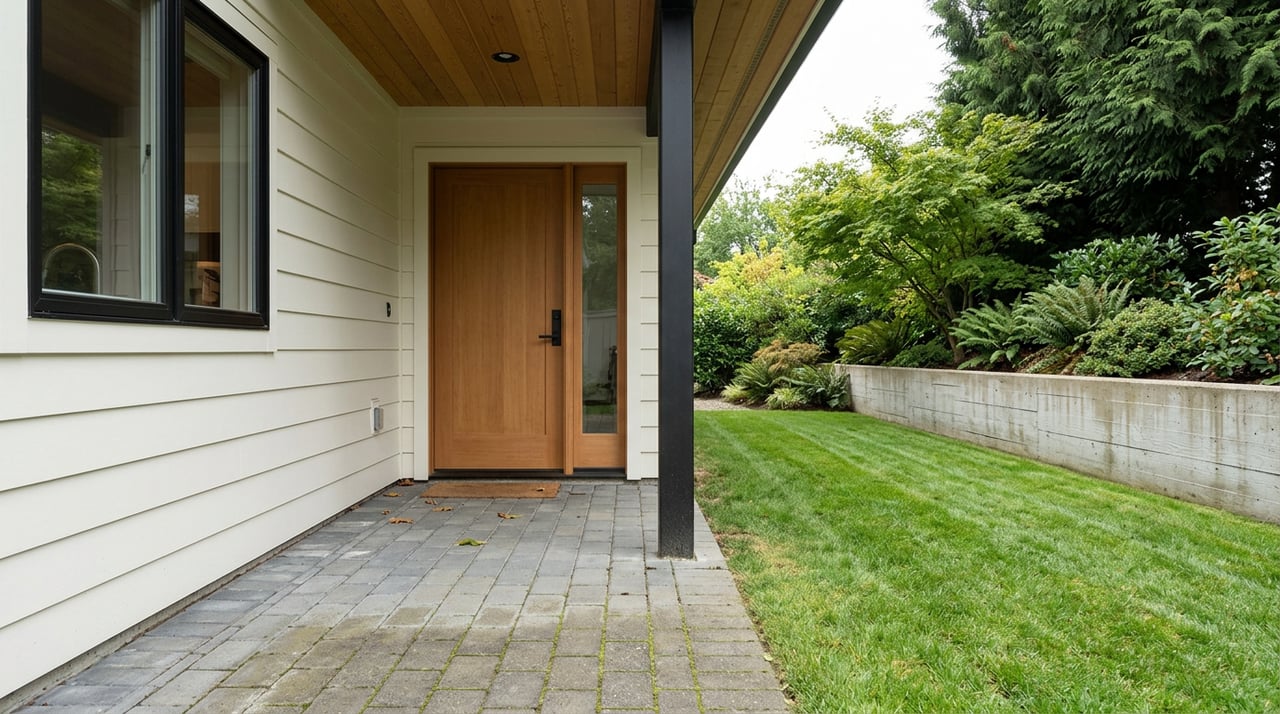
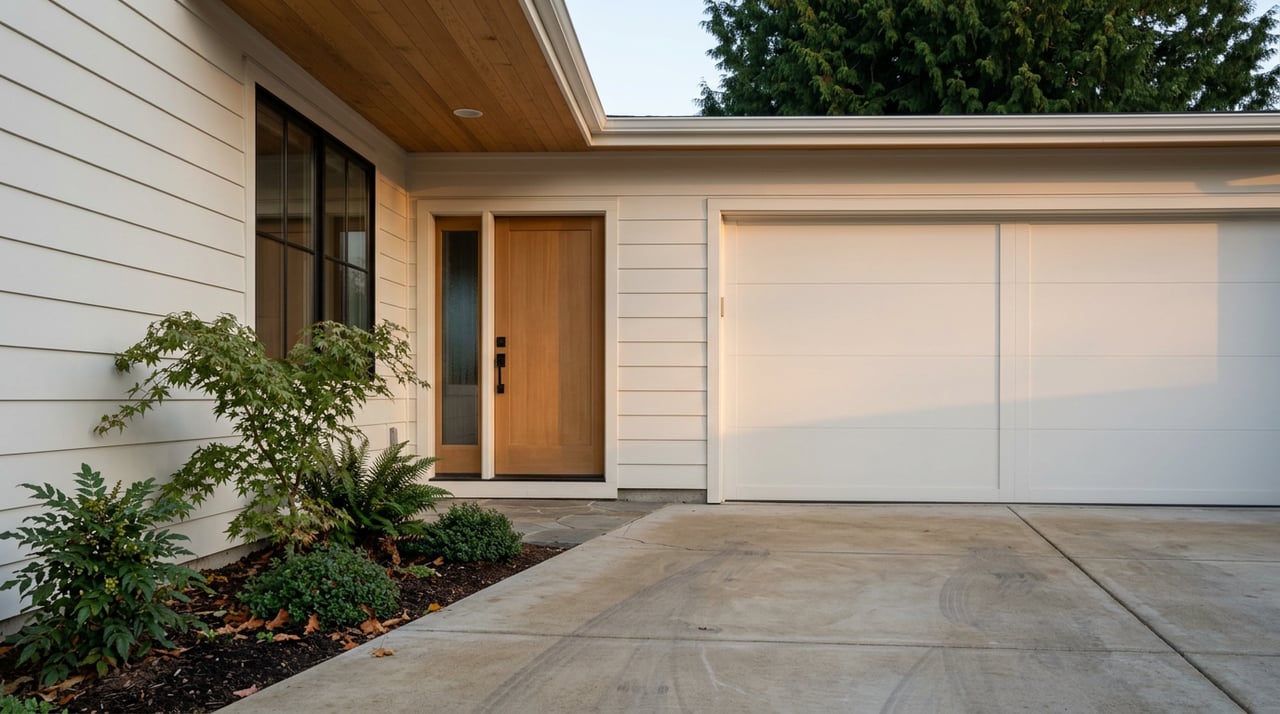
If you are thinking about buying or selling a property in Washington or Oregon, you need a Realtor that knows the market. You will be my absolute focus. I will work with you every step of the way. First property or moving to your forever home, I will make the process simple, efficient and tailored to your wishes.


